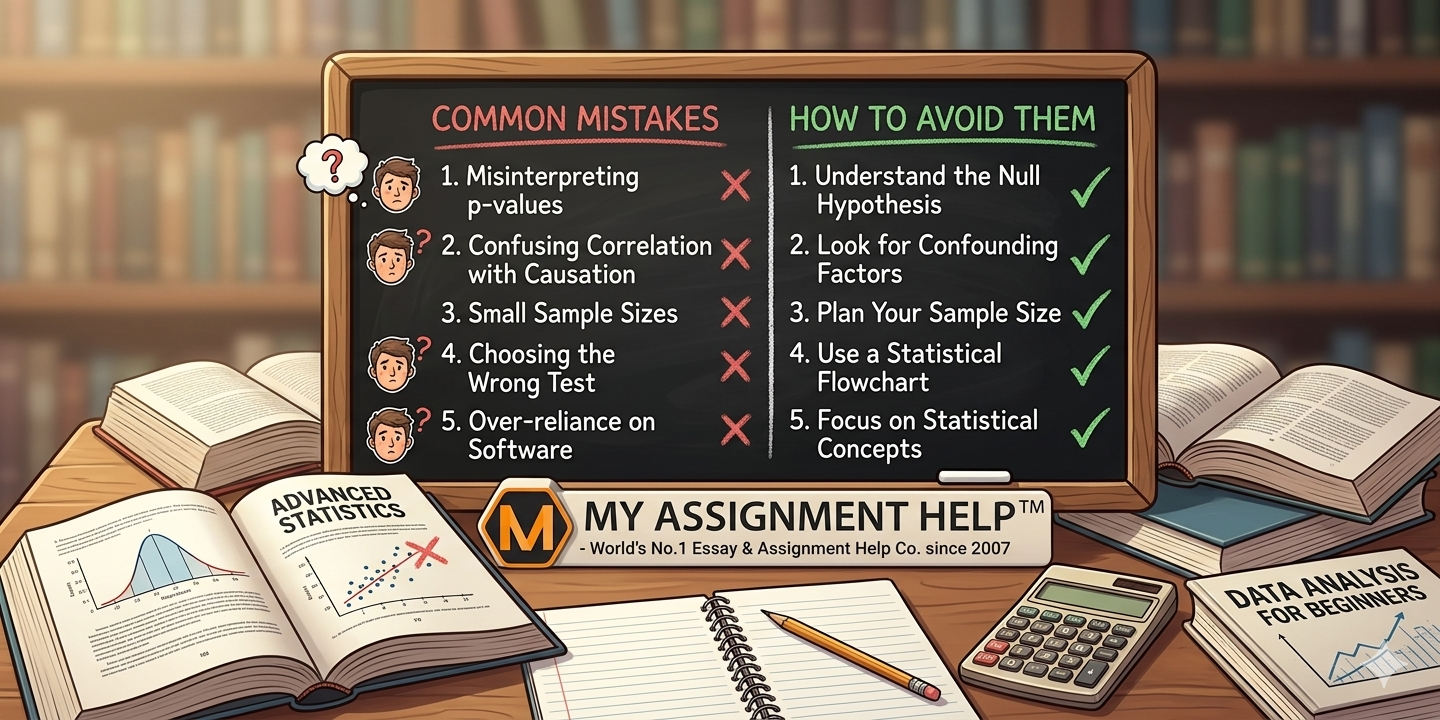
Data rules the modern world. From algorithmic recommendations to healthcare analytics, statistical literacy is no longer just an academic requirement—it is a critical career skill. Yet, for many students, introductory and advanced statistics courses feel less like a gateway to insight and more like a mathematical minefield.
The transition from standard algebraic mathematics to statistical reasoning is notoriously difficult. While traditional math often focuses on exact formulas to find a singular right answer, statistics requires comfortable navigation through uncertainty, variability, and contextual interpretation. Consequently, students frequently stumble over predictable conceptual and procedural hurdles.
1. The Core Misconceptions: Why Statistics Trips Students Up
Statistics is unique because it forces us to challenge our natural cognitive biases. Human brains are wired to find patterns, even where none exist. In academic environments, this translates into specific, recurring errors.
Confusing Correlation with Causation
Perhaps the most famous statistical pitfall is the assumption that because two variables move together, one must cause the other.
- The Error: A student runs a regression analysis on a dataset and finds a high correlation between ice cream sales and sunburn incidents. They conclude that ice cream consumption causes sunburns.
- The Reality: They have ignored a critical confounding variable (or lurking variable)—temperature and sun exposure. Higher temperatures cause an increase in both metrics.
Misinterpreting p-Values and Statistical Significance
The p-value is one of the most widely used—and widely misunderstood—metrics in academic research.
- The Error: Students frequently write that a p-value of 0.04 means “there is a 96% chance that the alternative hypothesis is true.”
- The Reality: A p-value only tells you the probability of obtaining data as extreme as what was observed, assuming the null hypothesis is true. It does not measure the probability that a hypothesis is correct, nor does it reflect the practical magnitude of the effect.
Violation of Statistical Assumptions
Every statistical test, from a simple t-test to complex multivariate ANOVA, comes with a strict set of assumptions such as normality, homoscedasticity, and independence of observations.
- The Error: Students often dive straight into running parametric tests on a dataset without checking if the data is skewed or if outliers are distorting the variance.
- The Reality: Running a test on data that violates its core assumptions yields invalid p-values and misleading confidence intervals, rendering the entire analysis scientifically useless.
2. The High Cost of Academic Friction
The academic stakes are exceptionally high when it comes to quantitative coursework. According to institutional research data from organizations like the National Center for Education Statistics (NCES), STEM and quantitative courses experience some of the highest rates of academic friction, often leading to dropped majors or extended graduation timelines.
Many students find themselves overwhelmed by the sheer volume of formula memorization, software syntax (such as R, SPSS, or Python), and theoretical proofs. When assignments pile up, conceptual errors compound, leading to poor grades and intense academic stress. During these critical bottlenecks, seeking structural academic support can prevent a temporary setback from derailing an entire semester.
Navigating complex data cleaning, model validation, and hypothesis testing often requires personalized guidance. Platforms like myassignmenthelp offer targeted, step-by-step help with statistics assignment challenges, ensuring that students do not just finish their coursework on time, but actually grasp the underlying mathematical frameworks. Whether you need an expert to review your methodology, debug your R script, or explicitly explain how to interpret a complex ANOVA output, leveraging professional academic tools can transform a frustrating roadblock into a valuable learning breakthrough.
3. Deep Dive: A Blueprint of Common Statistical Pitfalls
To truly avoid errors, we must look at where they happen most frequently: sampling, descriptive metrics, and hypothesis testing.
Sampling Bias and Sample Size Mistakes
A brilliant analysis applied to bad data will still yield bad results. This is the “Garbage In, Garbage Out” rule of statistics.
- Underpowered Studies (Small Sample Sizes): Students often attempt to draw sweeping conclusions about a population based on a sample size of 10 or 15 observations. Small samples suffer from high variability, making it incredibly difficult to detect a true effect (Type II error).
- Selection Bias: Utilizing convenience sampling (e.g., surveying only friends on social media) and treating it as a representative sample of the general U.S. population.
Misuse of Central Tendency (Mean vs. Median)
Choosing the wrong metric to describe “the average” is a classic mistake that distorts real-world data landscapes.
- Mean (Arithmetic Average): Best used for symmetrical, normally distributed data without extreme values. It is highly sensitive to outliers and skewed data.
- Median (Middle Value): Best used for skewed data distributions, such as household income or real estate prices. It ignores the exact value of extreme data points.
- Mode (Most Frequent): Best used for categorical or nominal data, like favorite brand or political affiliation. It can be bi-modal or non-existent in continuous data.
If a student calculates the mean income of a room containing nine middle-class workers and one billionaire, the mean will suggest everyone in the room is a multi-millionaire. In this skewed scenario, the median provides the accurate structural picture.
Confusing Type I and Type II Errors
When performing hypothesis testing, students regularly swap the definitions of these two critical errors:
- Type I Error: Rejecting the null hypothesis when it is actually true (a “False Positive”). Example: Concluding a medical treatment works when it actually has no effect.
- Type II Error: Failing to reject the null hypothesis when it is actually false (a “False Negative”). Example: Missing a real trend or planetary shift because the sample size was too small.
4. Visualizing the Data: Mean vs. Median in Skewed Distributions
When dealing with asymmetrical data, relying on the wrong average completely distorts your conclusions. The infographic layout below highlights how extreme values pull these metrics apart.
- Left-Skewed (Negative Skew): The long tail extends to the left. Here, the Mean is pulled down by the low outliers, making it less than the Median.
- Symmetrical Distribution: A perfect bell curve. The Mean, Median, and Mode all align perfectly right in the center.
- Right-Skewed (Positive Skew): The long tail extends to the right. High-value outliers pull the Mean upward, making it greater than the Median.
5. Strategic Guide: How to Master Statistics and Ace Your Assignments
Overcoming these challenges requires a shift from passive reading to active, structured study habits.
Master the Software, but Understand the Math
Do not treat software programs like SPSS, R, or Minitab as magic black boxes. Anyone can type a basic command into R and get an output. The value lies in knowing why you chose a linear model and how to interpret the residual standard error. Sketch out formulas by hand before automating them.
Visualize Your Data Early
Never run a statistical test without plotting your data first. Boxplots, histograms, and scatterplots are immediate, visual defense mechanisms against structural errors. They reveal outliers, skewness, and non-linear relationships instantly.
Build an Academic Support Network
When assignments accumulate across multiple subjects, it is easy to cut corners on complex statistical proofs. If you find yourself drowning in calculations and thinking, “I need someone to make my assignment transparent and easy to understand,” do not hesitate to seek structured academic support. Professional mentoring platforms can clarify ambiguous guidelines, walk you through messy datasets, and ensure your reports fulfill rigorous academic criteria.
Key Takeaways
- Context is King: Never analyze numbers in a vacuum. Always anchor your mathematical conclusions back to the real-world operational definitions of your variables.
- Respect Assumptions: Never skip exploratory data analysis. Verify normality, variance equality, and independence before selecting a test.
- Significance vs. Importance: A tiny p-value on a massive sample can be practically meaningless. Always look at the effect size to determine real-world impact.
- Verify Your Tools: Utilize visual diagnostics like Q-Q plots and residual scatter plots to confirm that your statistical models are structurally sound.
See also: How Smart Gadgets Are Transforming Everyday Life
Frequently Asked Questions (FAQ)
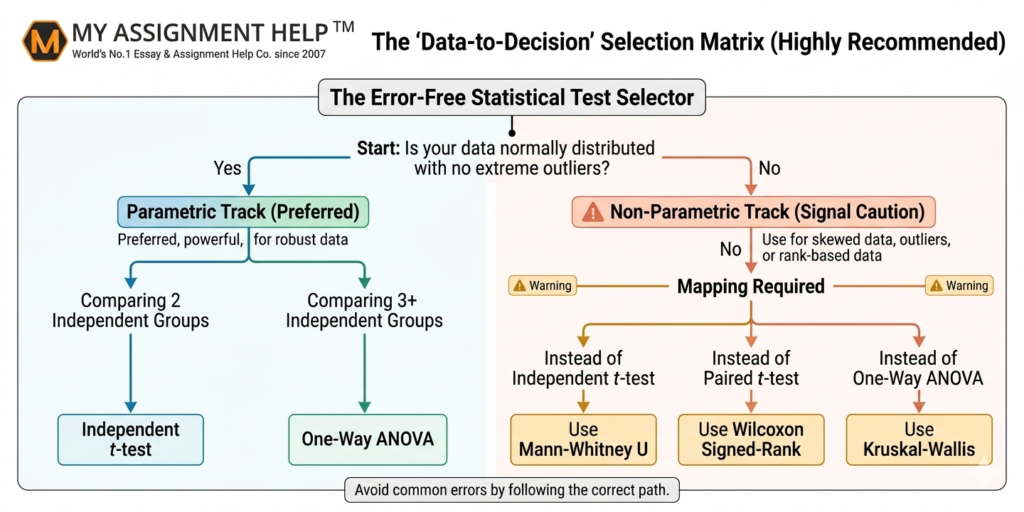
Q1: How do I know whether to use a parametric or a non-parametric test?
Ans: Parametric tests (like t-tests and ANOVA) assume your data follows a specific distribution (usually normal) and continuous scales. If your data severely violates normality, has a very small sample size, or uses ordinal/ranked data, you must switch to a non-parametric alternative (like the Wilcoxon Signed-Rank test or Kruskal-Wallis test).
Q2: Why is an outlier so dangerous in linear regression models?
Ans: Linear regression relies on the Method of Least Squares, which minimizes the sum of squared residuals. Because residuals are squared, an outlier that sits far away from the regression line exerts immense leverage, drastically pulling the line toward itself and distorting both the slope and intercept coefficients.
Q3: What is the difference between standard deviation and standard error
? Ans: Standard deviation measures the amount of variability or dispersion of individual data points within a single sample. Standard error, specifically the standard error of the mean, measures how much the sample mean is expected to vary from the true population mean across multiple samples.
References and Authoritative Data Sources
- National Center for Education Statistics (NCES): Long-term tracking data regarding STEM attrition rates and quantitative course friction points across U.S. universities. (nces.ed.gov)
- Wasserstein, R. L., & Lazar, N. A. (2016): “The ASA’s Statement on p-Values: Context, Process, and Purpose.” The American Statistician, 70(2), 129-133. This foundational text outlines the global scientific consensus on avoiding the misinterpretation of statistical significance.
- Cumming, G. (2014): “The New Statistics: Why and How.” Psychological Science, 25(1), 7-29. Emphasizes the crucial shift from relying strictly on p-values to utilizing effect sizes, confidence intervals, and meta-analyses.
About the Author
Dr. Evelyn Vance is a Senior Content Strategist and Academic Consultant at myassignmenthelp. She holds a Ph.D. in Applied Statistics and Behavioral Data Analytics from Northwestern University. With over nine years of experience teaching university-level biostatistics and experimental design, Dr. Vance focuses on deconstructing complex econometric and mathematical models into accessible, data-driven learning frameworks for students worldwide.